
Originally published on: March 24th 2019

Originally published on www.childrenshealthdefense.org
Board-certified pediatrician Paul Thomas, who has a thriving practice in Portland, has just furnished a stunning response to officials’ demand that he “show the proof” that the slower, evidence-based vaccine schedule he recommends is safer than the CDC schedule. After opening up his practice data to a deep dive by an independent and internationally known health informatics expert, the consultant found results that amazed them both: ten years of practice data clearly show that unvaccinated and partially vaccinated children have a dramatically lower risk of autism compared to children vaccinated according to the CDC schedule
By JB Handley, Children’s Health Defense Director and Co-Founder of Generation Rescue
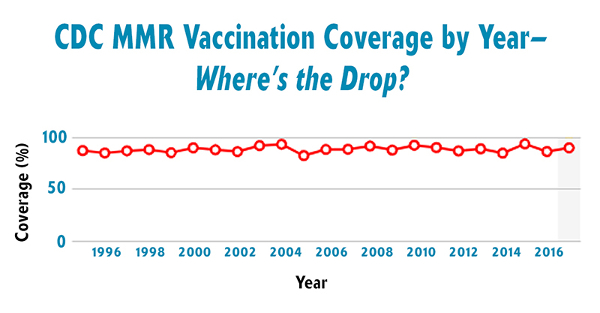
There’s a narrative being spread that the vaccination rate for the MMR vaccine has fallen lately due to irresponsible parents, and that the only way to fix the declining rate is to tighten up vaccine exemption laws in every state, which led me to ask a fairly obvious question about my home state: “What has the MMR vaccination rate in Oregon been over time (and why can’t I find that in any of the hysterical media)?”
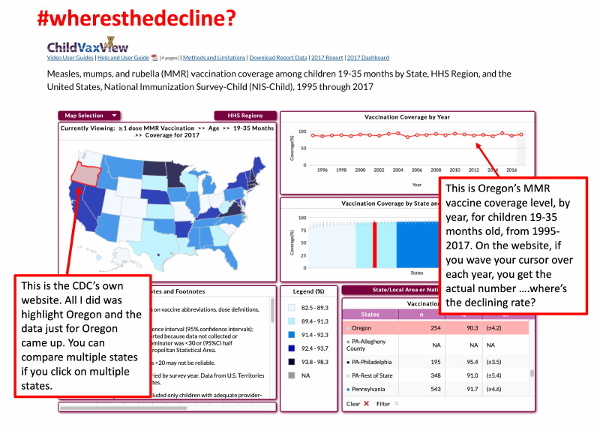
Luckily, the CDC has a super-easy, interactive map that answers this question very clearly, and I hope any members of the media with a brain start to take a look at the actual data, I took a screenshot of Oregon’s and you better take a screenshot of your state’s before the CDC takes down this weblink:
https://www.cdc.gov/…/chi…/data-reports/mmr/trend/index.html
So, what the heck is going on?
Why is the media saying that parents aren’t vaccinating and therefore measles is making a comeback? Let me explain:
- The media abuses the vaccine exemption number, not the MMR vaccination number. Parents file exemptions anytime they don‘t get EVERY vaccine required for school for their child. In Oregon, if you get 0 of 24 or 23 of 24 vaccines required for school for your child, you are counted as “exempt.“
- What the Oregon Health Authority knows, and is true in every other state, is that exemptions go up when one thing happens: new vaccines are added to the required school schedule. Quoting the Oregon Health Authority who wrote: “When other vaccines have been added as school immunization requirements, non-medical exemption rates have increased for all vaccines.“ Why would that happen? Two reasons: 1. Administrative burden, and 2. Wariness of brand new vaccine requirements (like, “does my kid really need Hep A?“.)
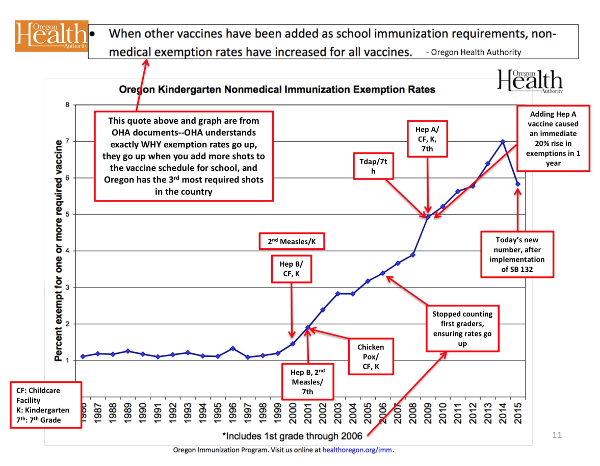
So, basically, here’s how it works: abuse and misinterpret a rising exemption number–guaranteed to go up if you add new vaccine requirements to the schedule–and generalize that it’s happening for all vaccines. Then, NEVER show the historical data, because it decimates your story.
I hope state activists grab the data for their state, share it with their legislators, and ask a simple question:
“Where’s the decline?”
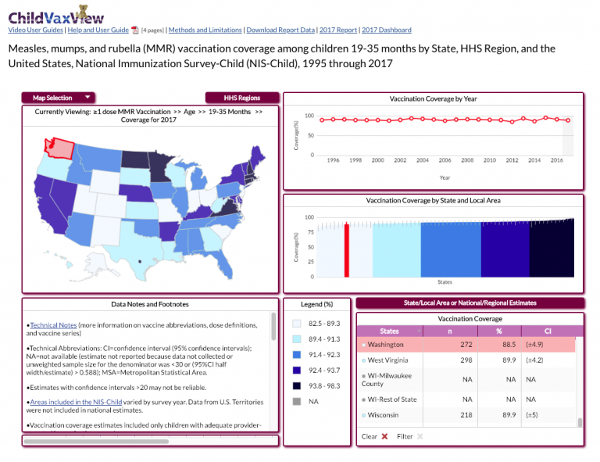
Since Washington State is facing an exemption fight, I grabbed a screen shot of WA data. Why can’t people just be honest about the data? #wheresthedecline
I also pasted below a table of Oregon’s actual numbers, from 1995 to 2017, please show me where the material decline happened (from year to year, there will be some natural variation, because this is a survey.)
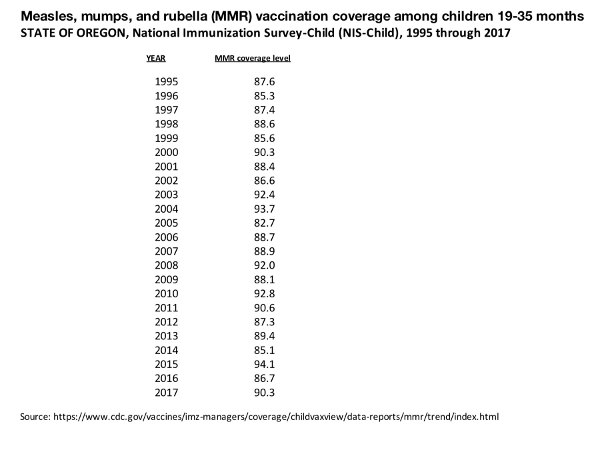
Truthful Data Destroys the False Narrative
Note: this data above is for children, aged 19-35 months. By the time these kids get into school, the vaccination rate goes even higher. What’s so important about all this data is that it destroys the false narrative. Vaccination rates haven’t gone down lately. Period. Ask any epidemiologist you know to run these numbers. The trend lines are ALL flat. Since 1995. I also know that each year, here in Oregon, the OHA’s data and the NIS data from CDC are generally the same, so I’d love to see OHA produce the MMR vaccination rate data since 1995 and ask them a simple question: why not tell the truth?
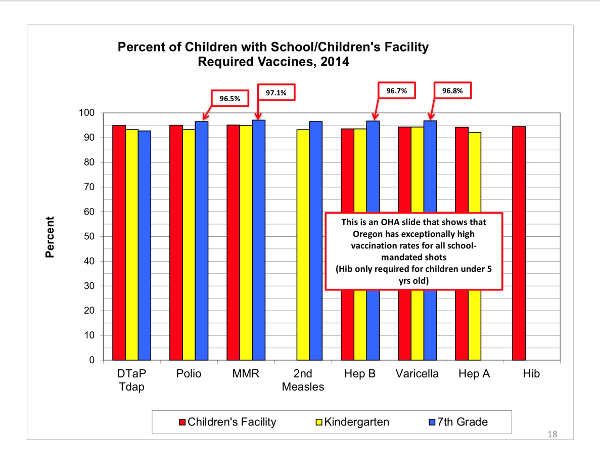
When I looked at the CDC’s numbers, it clearly showed that the MMR vaccination rate has held steady for more than 20 years. I wanted to make sure and corroborate that data with data from the Oregon Health Authority, which they conveniently don’t publish very often, but someone sent me their data from 2014, showing that 97.1% of 7th graders in Oregon have received an MMR vaccine! Where’s the decline?

© March 24th 2019 GreenMedInfo LLC. This work is reproduced and distributed with the permission of GreenMedInfo LLC. Want to learn more from GreenMedInfo? Sign up for the newsletter here https://www.greenmedinfo.com/greenmed/newsletter.
Source: Original Article
Originally published on: March 24th 2019